
Pick Datadog if you want one vendor to run everything and you can live with per-host and per-event billing that grows with your fleet. Pick Grafana, self-hosted or Grafana Cloud, if you’d rather pay per unit of data and keep the option to leave. Either way, instrument with OpenTelemetry first, so the backend stays a decision you can reverse.
We run the open source Grafana stack for clients. On one engagement, for a US transportation services company, moving metrics and logs off a commercial APM came with about USD 5,000 a month less in observability spend. I can’t name the vendor. What follows is how I’d decide for a team of 20 to 200 engineers.
What is the actual difference between Grafana and Datadog?
Datadog is a single SaaS product: agents, storage, dashboards, alerting, APM and a long list of add-ons, all run by Datadog and billed per product. You operate none of it.
Grafana is two things people mix up. One is a set of open source projects you can run yourself: Grafana for dashboards, Loki for logs, Tempo for traces, Mimir for metrics, Pyroscope for profiles. The other is Grafana Cloud, the hosted version run by Grafana Labs, with its own usage-based pricing. You can also mix them, running Prometheus-compatible storage yourself and Grafana for the views, which is what we did on one client platform.
So the comparison has three options: Datadog, Grafana Cloud, and a self-hosted open source stack.
How does each one bill you?
The units don’t match.
| Option | What you pay for | What makes the bill grow |
|---|---|---|
| Datadog | Hosts, plus log volume twice (ingest, then index), plus custom metrics past a per-host allotment | More hosts; more log volume |
| Grafana Cloud | Units of telemetry: active metric series, then GB of logs processed, written and retained | More active series; more log volume |
| Self-hosted Grafana stack | Compute, storage and the engineers who keep it running | More data to store, and the hours to run it |
The last row is the one people leave out of the spreadsheet. Open source removes the license fee and keeps the people.
The list prices behind the first two rows: Datadog Infrastructure Pro starts at USD 15 per host per month billed annually (USD 18 on demand), APM at USD 31 per host with infrastructure attached, log ingestion at USD 0.10 per GB, and standard indexing at USD 1.70 per million log events with 15-day retention. Pro includes 100 custom metrics per host. Grafana Cloud has a free tier with 14-day retention, then Pro from USD 19 a month plus usage: USD 6.50 per 1,000 active series after the first 10,000, and for logs USD 0.05 to process, 0.40 to write and 0.10 to retain per GB after the first 50 GB. Enterprise starts at a USD 25,000 yearly commitment.
Which is cheaper for a growing team?
It depends on what grows faster in your system, hosts or data. Two quick illustrations at list price.
Datadog with 20 hosts, Infrastructure Pro and APM, billed annually: 20 × (15 + 31) = USD 920 a month, before logs and before any custom metrics over the allotment.
Grafana Cloud Pro with 100,000 active metric series and 500 GB of logs a month: 19 + (90 × 6.50) + (450 × 0.55) = 19 + 585 + 247.50 = USD 851.50 a month, before traces and profiles. The 90 is 100 thousand series less the 10 thousand included, the 450 is 500 GB less the 50 included, and 0.55 is processing, writing and retaining a GB (0.05 + 0.40 + 0.10).
The two numbers measure different things, and that’s the point. A fleet of many small hosts with modest data weighs more on host pricing. A few large nodes with high-cardinality metrics weigh more on series pricing. Before you compare vendors, count your hosts, your active series and your log GB a month. In my experience most teams know the first number and guess the other two.
Two habits cut the bill on either side. Drop logs nobody queries before they are ingested, and remove labels that explode metric cardinality, like user IDs and request IDs. Neither needs a new contract. Someone just has to sit down and do it.
Where does lock-in actually live?
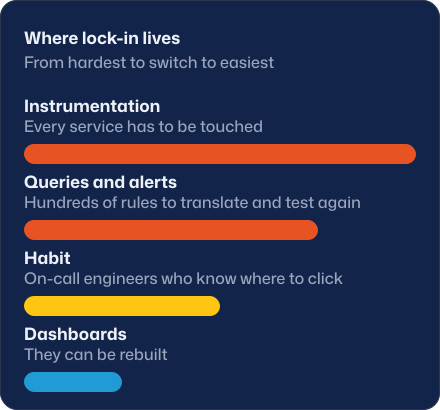
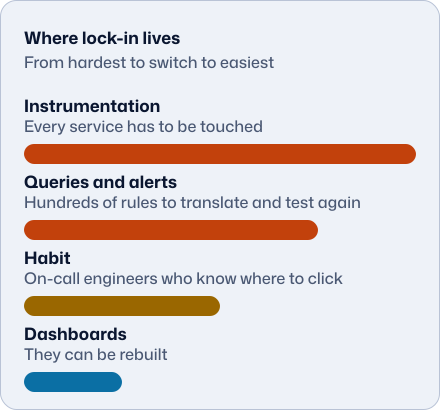
Dashboards get the attention, but a dashboard can be rebuilt. The lock-in that costs money is somewhere else.
Instrumentation is the expensive one. If your services emit telemetry through a vendor’s own agent and libraries, switching means touching every service. Next come the query language and the alerts: hundreds of rules and saved queries written in one dialect have to be translated and tested again. Then habit. On-call engineers who know where to click during an incident are real, and that only moves with practice.
And then the license, which nobody reads until someone wants to resell the software. Grafana Labs moved its core open source projects from Apache 2.0 to AGPLv3 on April 20, 2021. AGPLv3 is fine for running Grafana, Loki or Tempo internally. If you plan to modify them and offer them to others as a service, read the license with your lawyer first.
Why should OpenTelemetry come before the vendor choice?
Because it takes the most expensive lock-in, instrumentation, out of the decision. OpenTelemetry describes itself as “vendor- and tool-agnostic” and “not an observability backend itself”, and its docs say “You own the data that you generate. There’s no vendor lock-in.” If services emit traces, metrics and logs through OpenTelemetry SDKs to an OpenTelemetry Collector, the backend becomes a configuration of the Collector’s exporters.
Check that each backend on your list accepts OTLP. If they do, send the same data to both during the evaluation and compare them on your own traffic.
That’s the setup on the platform we built for Autonomah: services emit OpenTelemetry to Google Cloud, plus a per-call cost ledger. Because the instrumentation is OpenTelemetry, moving to another backend shouldn’t mean re-instrumenting every service.
What does an open source stack look like in practice?
On MPI’s platform, which runs on Kubernetes in AWS, the stack is VictoriaMetrics for metrics, Loki for logs, Tempo for traces, Pyroscope for profiles and Grafana on top. Installing them was the easy part.
Alerts have to be proven to fire. You prove it by causing the condition and watching the alert go off, because a rule that has never fired is a guess. Production went from no evaluated alert rules at the start of September to 275 by mid-month. Noise has to go too. Alerts that fire without anyone needing to act get deleted or fixed, and you measure the result: the number of alerts firing at once fell 70% in about two weeks, from late September to early October 2026.
And storage has to stay put. We fixed a log store that node consolidation was recreating about three times a day. Self-hosting means failures like that are yours. If nobody on your team wants to operate storage systems, that’s the argument for a hosted backend, Grafana Cloud or Datadog.
How do you decide in one afternoon?
Answer five questions with numbers. How many hosts or nodes do you run, and how fast is that growing? How many active metric series do you have today (Prometheus can tell you)? How many GB of logs a month, and what share is ever queried? If you self-host, who operates the stack at 3 a.m.? And are your services instrumented with OpenTelemetry, a vendor agent, or nothing?
If the answer to the last one is “a vendor agent” or “nothing”, fix that first. The backend decision gets cheaper the moment the data is portable. And if nobody is sure who should own the stack at 3 a.m., SRE vs DevOps vs platform engineering draws those lines.
Is Grafana a real Datadog alternative?
For metrics, logs, traces and dashboards, yes. Datadog bundles more products in one console (security, synthetics, CI visibility and more), and some teams value one bill and one support contract. If you need those extras and don’t want to assemble them, that integration is what you’re paying Datadog for. If you mainly need the four signals and solid alerting, Grafana covers it, hosted or not.
Start with the signals, not the vendor: OpenTelemetry in the services, a Collector in the middle, three SLOs that describe what users feel, and alerts you have watched fire. That’s the scope of our SRE / Observability Foundations package, USD 5,000 for two weeks (metrics, logs and traces wired, 3 SLOs, alerts proven to fire, a runbook), and it works with either backend. The SRE and observability page has the details, and every package is on pricing.
Sources, accessed 2026-10-07: Datadog pricing, Grafana pricing, Grafana licensing, What is OpenTelemetry?.
Datadog and Grafana are trademarks of their respective owners. Clouditive is not affiliated with them.